

Making Run Differential More Accurate
Early season blowouts make using Run Differential misleading - how can I fix that?

After about a month into the 2025 MLB Season, I saw a few tweets about run differential that piqued my interest. Usually after 15-20 games, the standings often look nothing like how they will at the end of the season. Teams start off hot, have flukey wins, and in general the small sample size doesn’t tell the full story. Most of the time, commentators and analysts turn to run differential, a simple stat that accounts for runs scored for and against, and is known to be more accurate that record at the start of a season.
In fact, esteemed sabermetricist Bill James created “Pythagorean Win-Loss”, an equation using run differential that can predict a teams win loss for a given season with just run differential. It is accurate to about 3 games. Knowing this, many people use this formula to point out teams that may have gotten unlucky or underperformed their actual production at the end of a season.
Anyways, after a few weeks into a season, fans and analysts alike turn to run differential to see if their team is doing well. There is a problem with this though. Even though RD is supposed to account for a small sample size, that small sample size can greatly shift RD.
For example, the Boston Red Sox lost 18-7 to the Cardinals in their 10th game of the season, and 16-1 to the Rays in their 18th. If you were to look at the Red Sox RD in their 20th game without knowing these two blowouts happened, you would think they were a lot worse than they were. In the game of baseball, the difference between losing 7-1 and 16-1 are about the same.
I saw a thread on Twitter that mentioned this problem, and someone suggested that if someone created a run differential stat where the max runs you could win by were, let’s say, 6, it would be more accurate and a better predictor for the future. I searched for a stat like this and couldn’t find it, so I set out to make it myself. If something like this already exists, I couldn’t find it.
My thesis is that if I create an Adjusted Run Differential with a max margin of victory of 3.6 (more on that later), it will be a better predictor of past and future success.
I created a python script using MLB API to do this, and I am going to start by predicting the standings at the end of May, only using data from the first month of the season. Later on, i’ll see if using this Adjusted Run Differential will create a more accurate Pythagorean Win Loss Formula. I chose to replace all margin of victories above 3.6, with 3.6, because it is the average margin of victory in the MLB.
Below is the actual Run Differential for the first month of the MLB season on the left, and my adjusted one on the right.
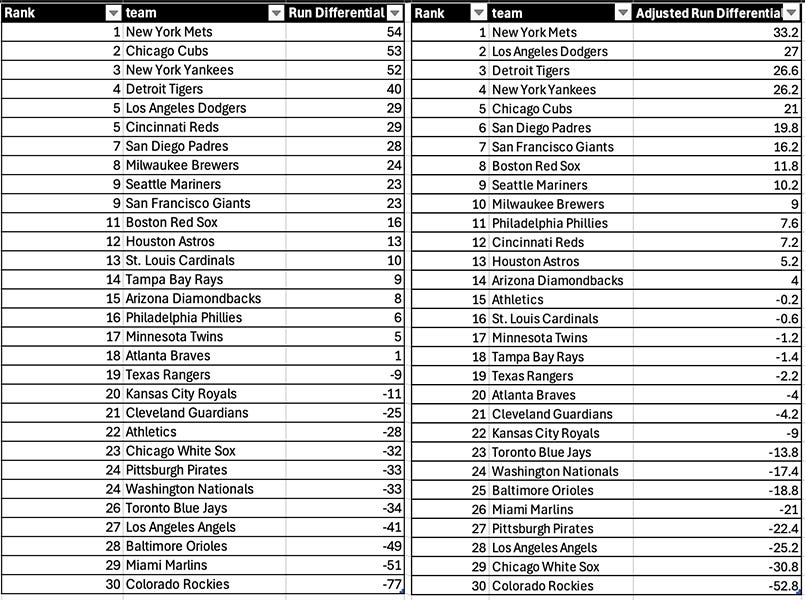
There is a decent amount, but not too much difference between the two lists. The Reds took a serious hit in the rankings, which makes sense, and the Athletics were the biggest risers, jumping 7 spots up. My Red Sox comment earlier seems to check out, since they jumped up 3 spots.
Now, i’m going to compare both of these lists to the actual standings at the end of June, and see which one predicts it better.
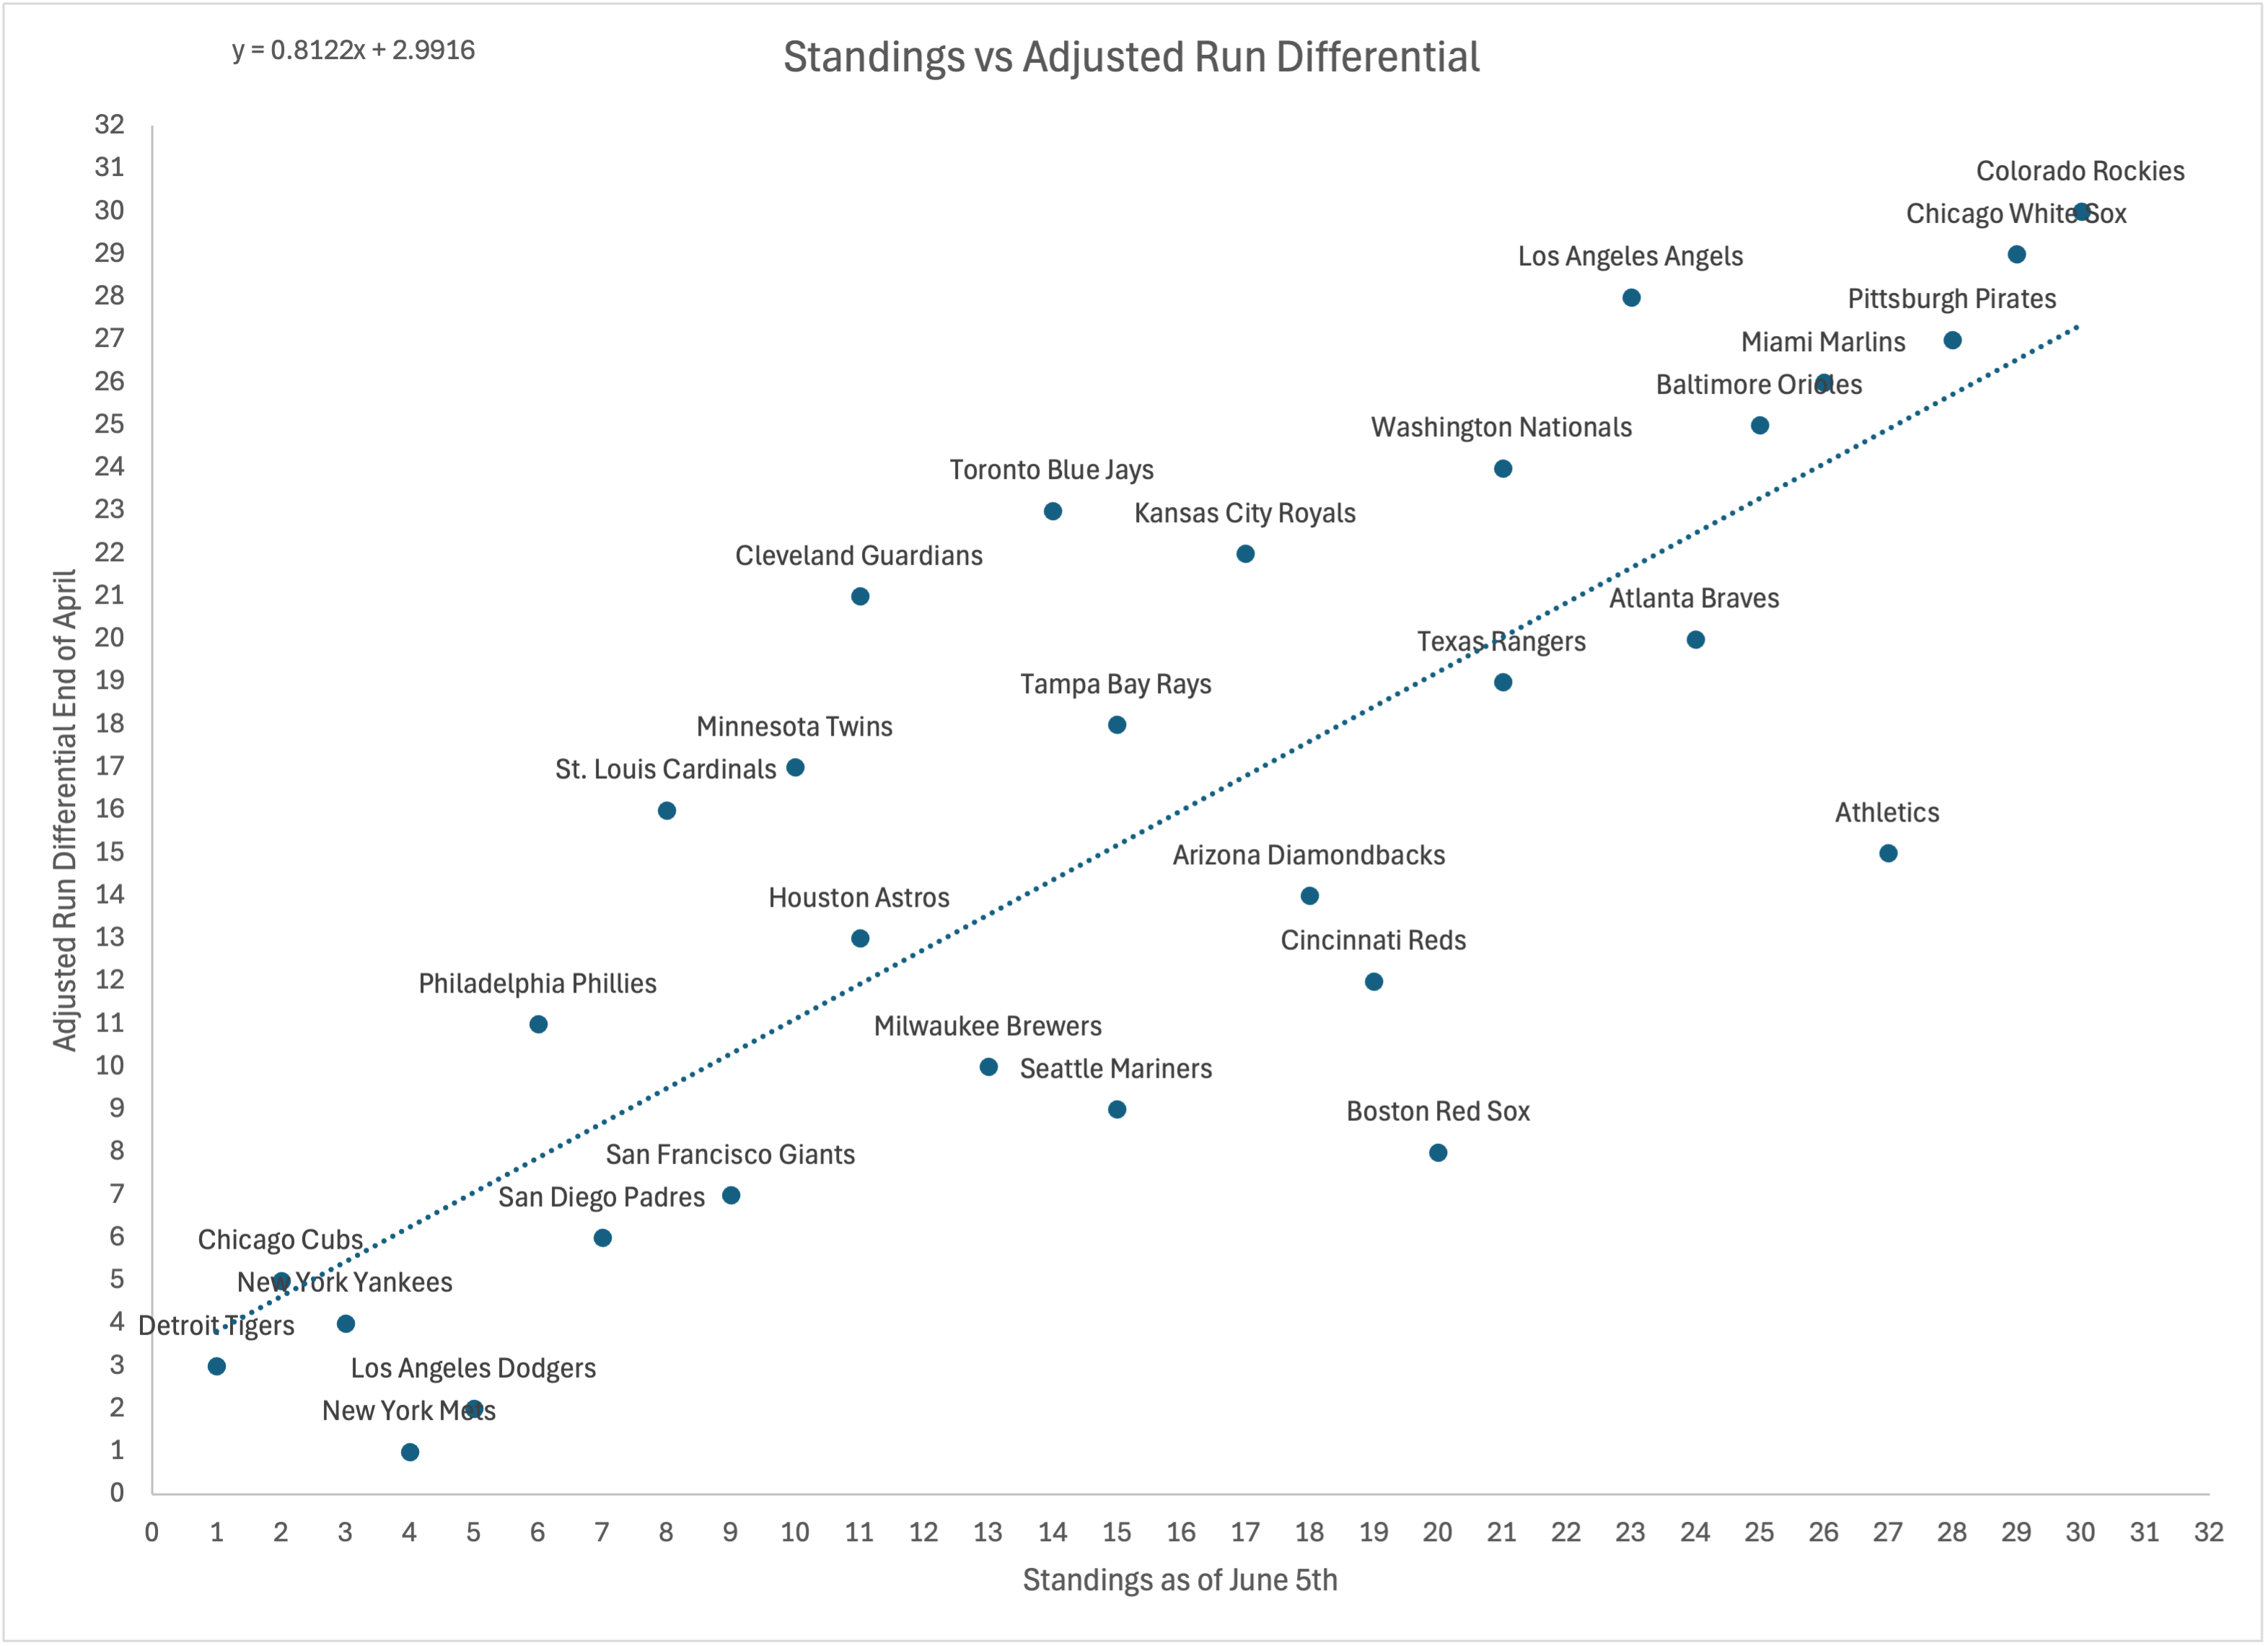
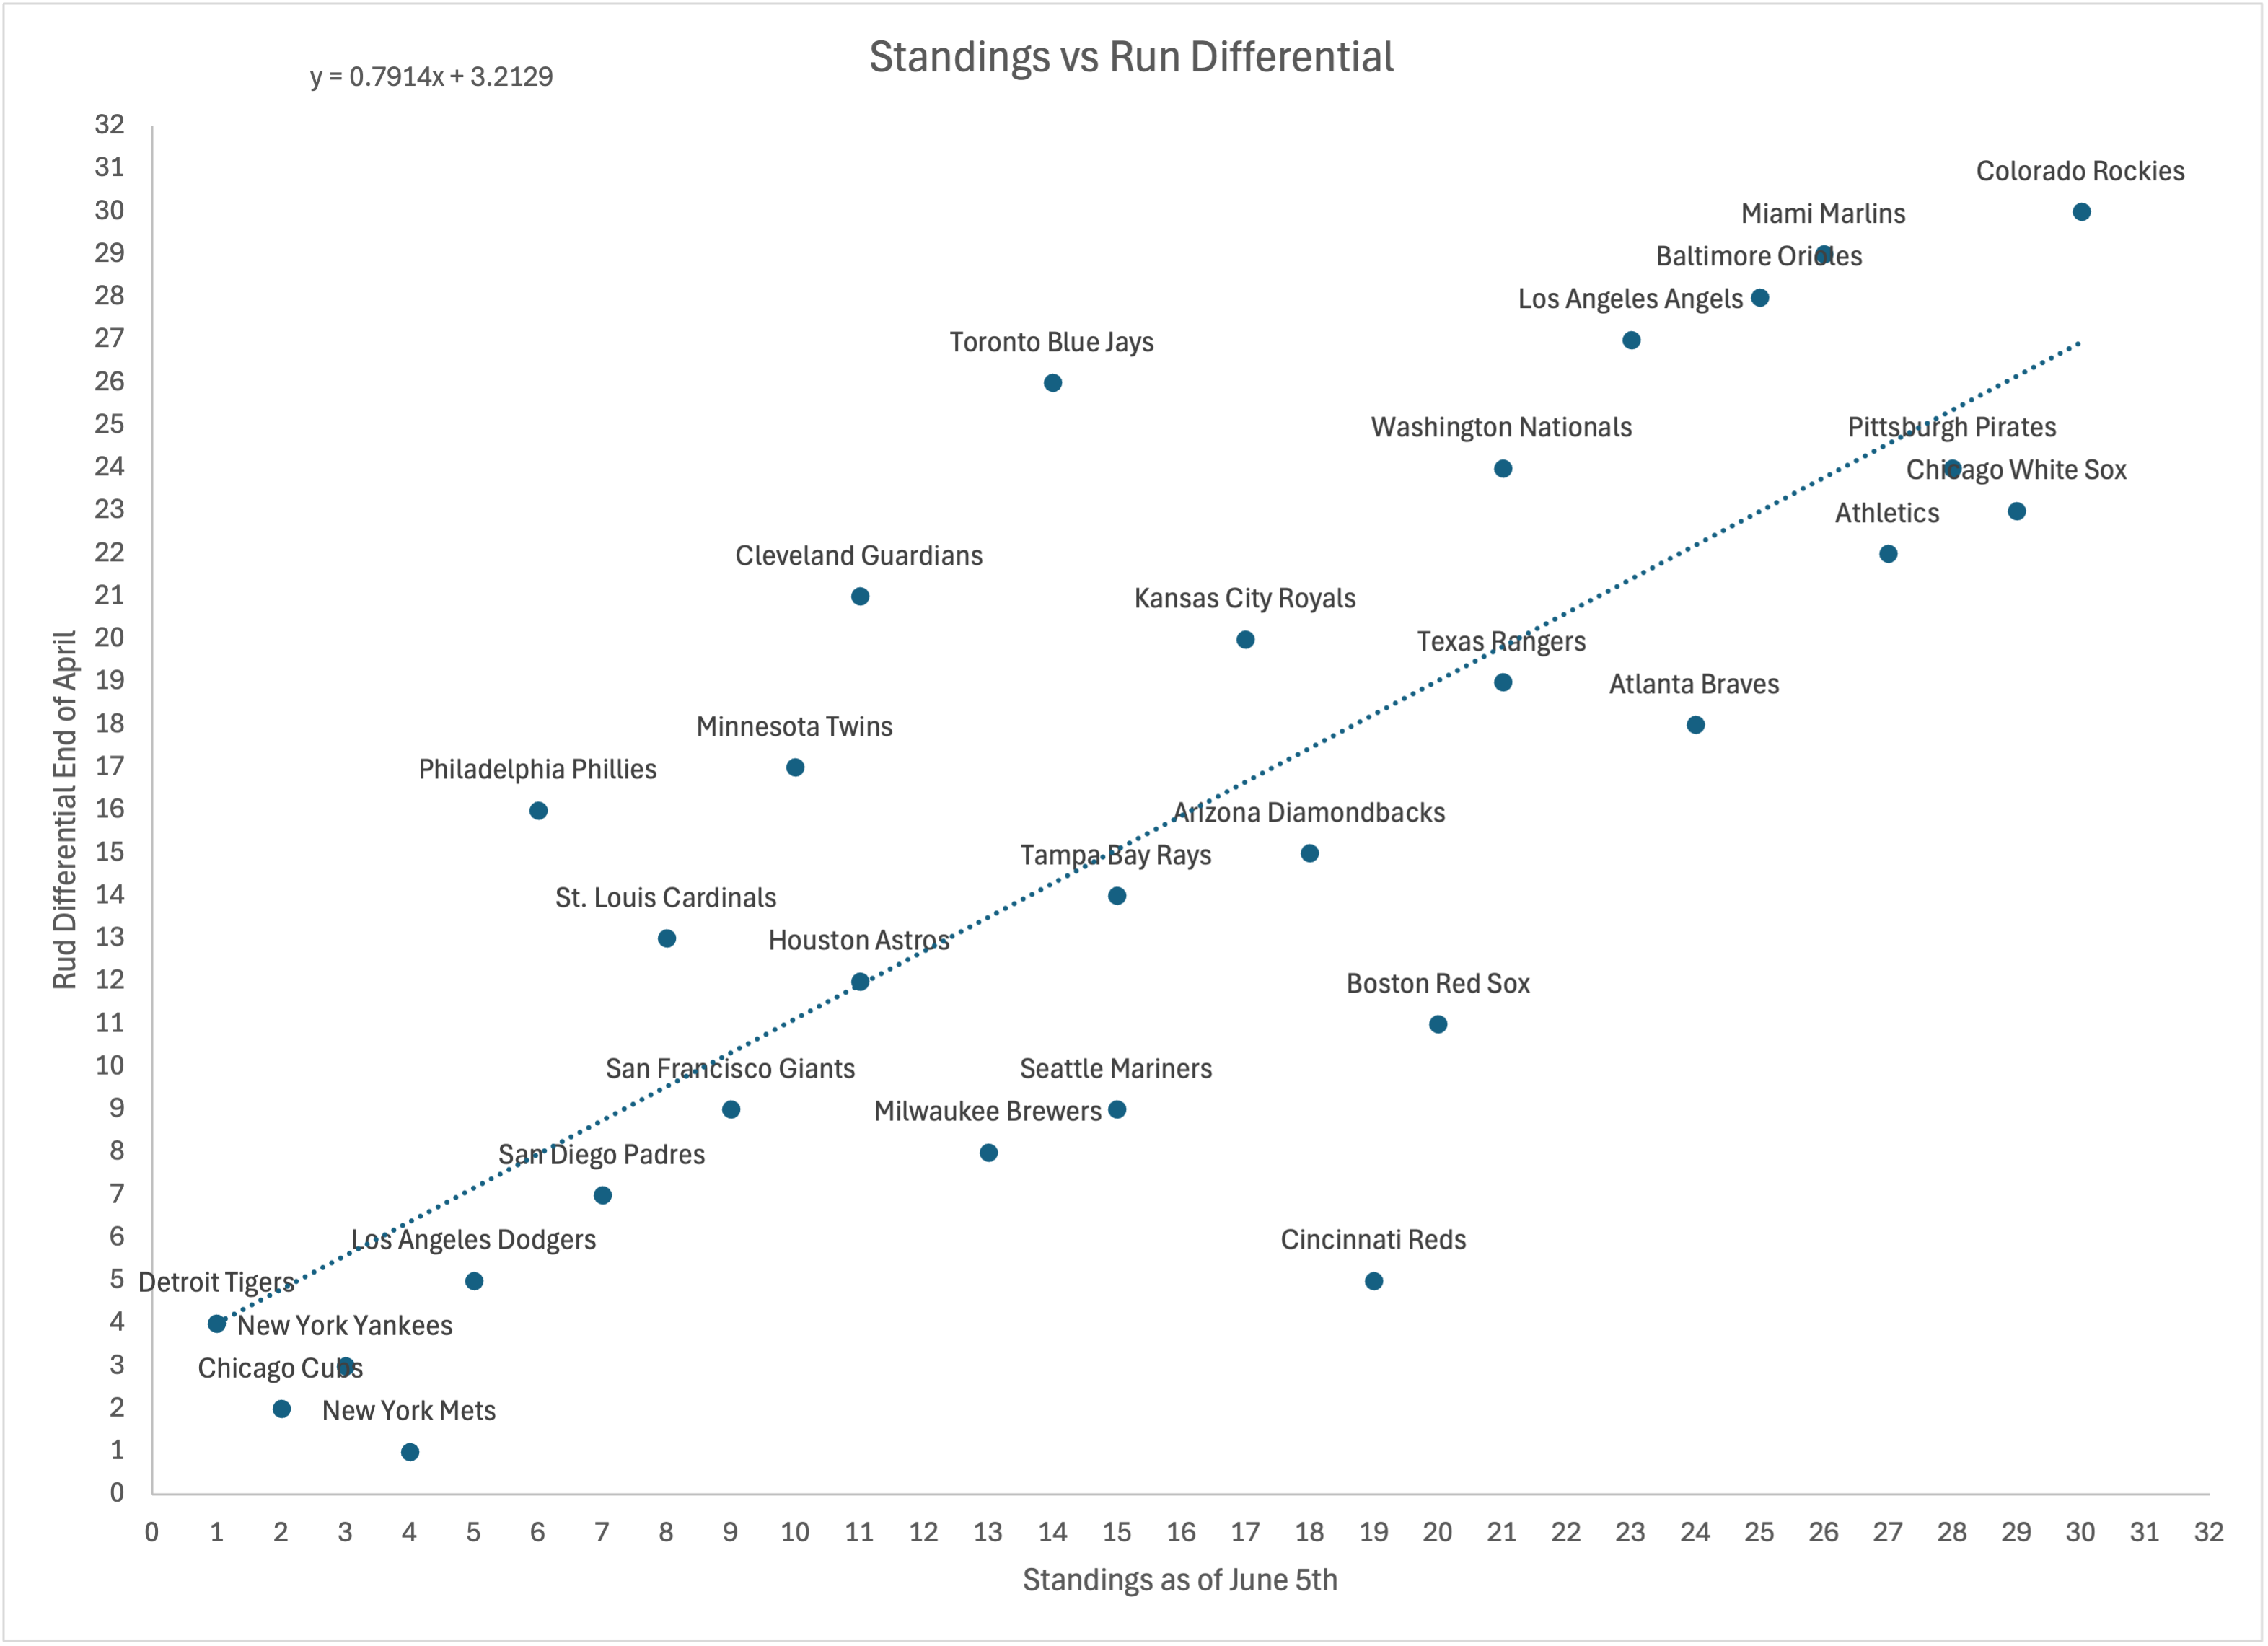
The two graphs above show the rankings of teams using both of the methods of calculating RD plotted against the standings as of June 5th. By graphing these two rankings, theoretically, if the run differential rankings were perfect, it the trend line would have a slope of 1. As you can tell from the small equations in the top left, the Adjusted Run Differential ranking slope was closer to 1 than normal Run Differential, meaning it predicted the future standings more accurately. You can get some pretty interesting information from these graphs as well. If a team is below the trend line, they underperformed compared to how they started the season (Reds and Red Sox), and if they are above the line, they improved based on how their season started.
While i’m sure that MLB teams have all sorts of models that can predict future records better than I can, it is still an eye opening result that adjusting the run differential makes a difference in predicting future success. Clearly, this shows that getting blown out by a ton of runs is not indicative of very much for either team. Another interesting result from this whole experience is that while any type of run differential is helpful for predicting future success, one month of the season does not mean much.
There are some more interesting things I could do with this data. I could look back at previous years and see if it can predict the future standings after the All-Star break, or use this run differential to calculate an adjusted Pythagorean win loss. There could be some interesting results from these, and maybe I will explore them in the future, but I think i’ve gleaned enough interesting factoids from the current results.
The biggest takeaway I have from this whole experiment is that small sample sizes can be very misleading. The first month, or even two or three, of the MLB season often doesn’t tell you very much. There is a reason why they play 162 games. The Boston Red Sox pitching staff last April looked incredible, but then the league adjusted and their magic wore off. I would stay away from using record or run differential until about the All Star break as a measure of a teams talent. Too many times Front Offices and Teams jump the gun and start thinking they can compete because of a small sample size with misleading stats.
At the end of the day, this is a cool result from some simple math and coding , and I’m gonna keep exploring and learning and expanding on this.